

Happy New Year Stats
Happy New Year! I hope 2025 is off to a great start for you all. 🌟
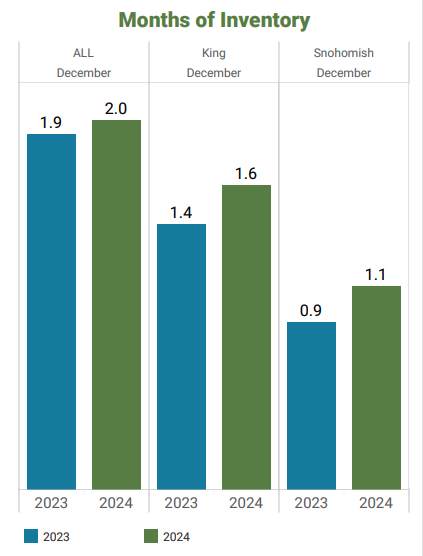
As 2024 came to a close, we saw less new inventory as is seasonally expected. YOY trends from 2023 to 2024 were quite similar and demonstrate the seasonality of our market. 🎄
Generally speaking, buyers who are home shopping during the holiday season are usually quite motivated. There can be some deals to be had during that time too as the market slows. So, what sort of offers were buyers making and do we think this will change as we get further into spring? 💡
Between King and Snohomish counties combined, multiple offers occurred only 30% of the time. Half of all offers included an inspection contingency, while 73% included a finance contingency for a home loan. (This does not mean that 50% of the people opted not to have an inspection. Though they waived the contingency, it is possible they received an inspection report from the seller to aid them in their decision. This is becoming more common practice.) Escalation clauses were fewer and farther between at only 9% of offers. 📊
As we get into spring, I would anticipate this trend reversing a bit, especially if inventory remains low. I would anticipate seeing more multiple offers and fewer contingencies. If you are considering a purchase this year, it may be a great time for you to jump in as competition isn't quite as frenzied. (At least not yet.) 🏡
If you are interested in learning more about this, please don't hesitate to reach out. I'd be glad to chat! 📲


May Stats + A Little Sunshine
It's stat time again! (See what I did there? 😂) If you haven't noticed, the media constantly uses headlines full of doom and gloom. Things like: "Home prices drop 8%!" seem to be the attention grabbing headlines they prefer. But guess what? Don't believe everything you read... 🧐
The media generally bases real estate headlines around year-over-year data. 📅 In the past, I have always relied on that data too. We have to remember though, that last spring's market was off the charts - low rates and sky high prices were the norm. 📈 Today we are looking at higher rates and slightly less of a feeding frenzy. Because of this, year-over-year stats just don't make as much sense. 🚫 Of course they look vastly different - they were skewed by that frenzied market! ‼️
So, to help combat the doom and gloom ⛈ and bring a little sunshine into our worlds, ☀️ I'll now be focusing on month-by-month changes because to me, that is a better indicator of what is happening NOW!
Key POSITIVE takeaways from May for both King and Snohomish counties:
🌟 Inventory is up slightly from April. (Though still far lower than we need to balance the buyer load.)
🌟 Median sales price is UP over 3% from April!
🌟 Days on market is down!
Rates are higher, yes, but when they drop, which they eventually will, the frenzy will return. 😳 Would you have rather bought in April and made 3% equity in just one month, or would you rather wait until rates drop, earning zero in the meantime and competing with everyone else? 🤔 I know which one I'd choose... ✅
If you'd like to see stats drilled down for a particular city or different county, let me know and I'm happy to send them your way! 😎

